Why IG3IS?
We know the Earth’s climate is changing in response to human emissions and that decisions must be made to mitigate the impacts. Learn more below:
These decisions depend on accurate, up-to-date greenhouse gas (GHG) emission data. Traditionally, emissions were estimated from national data, such as oil consumption or vehicle numbers. However, new scientific techniques now allow direct measurement of GHG concentrations in the atmosphere, which can be converted into emission estimates using computer models. This approach enables more accurate estimates at the necessary scale for decision-making, improving efficiency and cost-effectiveness for countries. Learn more below:
These techniques also extend beyond the national level. They can be applied to characterize emissions and uptake at the scale of cities and individual facilities. Knowing where and how much emissions are happening can help cities and industries manage their climate impact and assess the effectiveness of their actions. Learn more below:
Existing observation-based information systems and gaps
Observation-based GHG emissions information systems are being implemented in several countries worldwide. The United Kingdom, Switzerland, Australia, and New Zealand have successfully used top-down analyses (which rely on atmospheric observations) to improve their National Emission Inventory Reporting. Other Annex 1 countries with similar measurement and modelling capabilities could adopt these approaches.
However, some gaps remain:
- Many non-Annex I countries lack established inventories, making it difficult to determine the status of emissions on a common baseline
- Annual totals often do not include geographical and sectoral distribution of emissions
- Significant uncertainties exist in emissions and uptake from agriculture and land use, as CH4 and N2O come from diffuse, complex and variable sources.
- Verifying the impacts of climate change mitigation measures on atmospheric concentrations (which drive climate change) takes a longer time
Concept of IG3IS
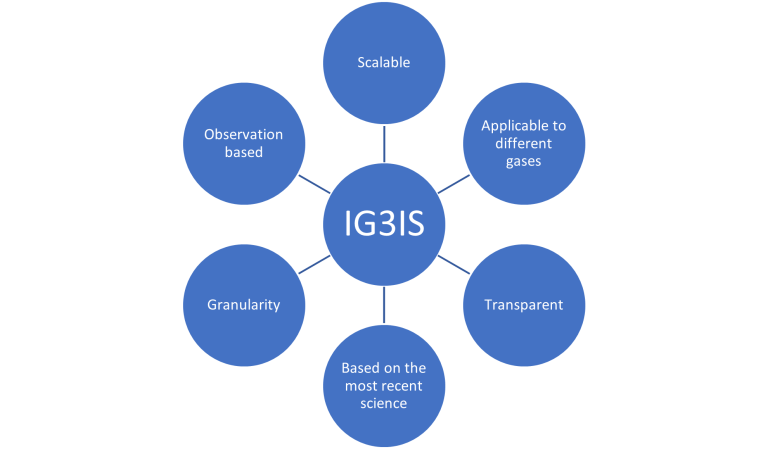
IG3IS is designed as an international coordination mechanism that links inventory and flux model data with atmospheric observations and modelling. This will provide the most accurate estimates of greenhouse gas emissions and uptakes at national, urban and facility scales.
It also aims to determine trends and distributions of GHGs in the atmosphere and assess whether these align with efforts to reduce GHG emissions. IG3IS is intended for decision-makers who can act to reduce GHG emissions and improve air quality.

This service builds on existing, proven methods and successful use cases with established scientific and technical expertise. IG3IS is not meant to monitor regulatory compliance but to offer policy- and management-relevant information, ensuring that the data aligns with a global network of high-quality observations and models.
IG3IS Logo Explained

When IG3IS is said out loud, it sounds like "I guess." However, by providing atmospheric measurements, our organization works to decrease the uncertainty, or guessing, associated with greenhouse gas (GHG) emissions. Therefore, we wanted our organization to show the progression of this change in uncertainty, from guessing to knowing, with the flipping of a question mark. As can be seen on the logo above, in light blue is a right side up question mark encasing the number three. However, what might be more difficult to see, is the dark blue question mark below, which also serves as the bottom of the letter "g." Both question marks share the same dot, almost as a point of rotation, but the second is entirely upside down, thus symbolizing the decrease in uncertainty or guessing.
Regarding the colors chosen for the logo, both the light blue and dark blue used are the same associated with the World Meteorological Organization (WMO), which is further explained through our partnership below. Furthermore, included within the opening of the "g" is the Global Atmosphere Watch (GAW) logo, an organization within the research division of WMO that hosts IG3IS.
Supporting mitigation actions
The Paris Agreement requires governments to limit atmospheric GHG concentrations and transparently track progress towards its climate goals. To support this, the IG3IS initiative aims to enhance the granularity of observations and analyses to help nations manage and plan their Nationally Determined Contribution (NDC) mitigation efforts at national and subnational levels.
Observation-based approaches for quantifying GHG emissions and uptakes can support post-COP21 actions, subnational governments and the private sector. This user-driven, science-based approach aims to:
- Improve understanding of atmospheric emissions and uptakes at national and smaller scale
- Guide progress on emission reduction strategies and actions for national and sub-national entities
- Expand GHG observational capacity to regional and urban levels
- identify significant emission reduction opportunities (e.g. industrial methane)
- Establish consensus on best-practices and guidelines
- Support quality control and benchmarking
